Technical Support Group (TSG) Operational Dashboard
The TSG Operational Dashboard is an essential platform for managing and optimizing field support activities. It is designed to enhance accountability, improve operational efficiencies, and systematically eliminate workflow bottlenecks across the entire support lifecycle. The dashboard provides real-time visibility for Project Managers, enabling precise monitoring, organization, and rapid work order dispatch based on comprehensive scope-of-work details.
To minimize response times for critical actions, the platform features specially configured alerts and dynamic notifications. Furthermore, it serves as the central cloud-based file repository, grouping and securely storing all ticket-related documentation. Field technicians are supported by a purpose-built mobile application, ensuring seamless access to the tools and data required for their specific work environment, and allowing for single-click requests for Radio Access Network (RAN) support.
Our Solution Gallery
Real-Time Control Center For Field Operations, Network Rollout, and Service Quality
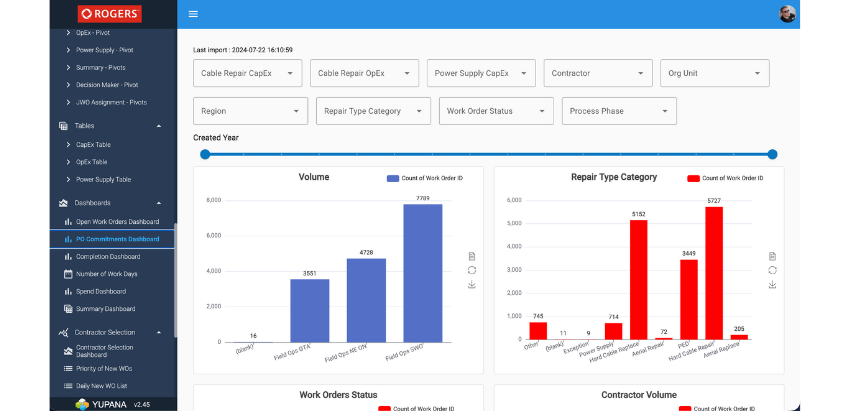
TSG Operational Dashboard brings together live network data, field activities, tickets, and work orders into a single, map-driven view. It gives operators, project managers, and NOC teams one place to see what’s happening in the field, what’s at risk, and what needs attention next.
TSG Operational Dashboard is a web-based command center for telecom and infrastructure projects. It consolidates alarms, KPIs, ticketing, fiber and RAN rollout progress, crew status, and SLA performance into one easy-to-use interface, with deep integration to YuCubeGC and TSG Fiber.
Key value propositions
- Single source of truth for rollouts, maintenance, and trouble tickets across regions and vendors.
- Live map & timeline views of sites, routes, crews, and open tasks.
- Integrated with YuCubeGC & TSG Fiber for real device data, OTDR results, and site status.
- Built-in ticketing and work orders with SLA tracking and escalation logic.
- Powerful analytics for PMO and management: progress vs. plan, risk heatmaps, contractor performance.
What is TSG Operational Dashboard?
TSG Operational Dashboard is Yupana’s operations cockpit for large-scale telecom and critical infrastructure projects. It connects to network elements, automation platforms (YuCubeGC), fiber tools (TSG Fiber), and field teams to give a real-time picture of:
- Which sites and fiber segments are live, in rollout, or at risk
- Which tickets and work orders are open, delayed, or breaching SLA
- Which contractors and crews are on site, idle, or overloaded
- How current performance compares to project targets and contractual KPIs
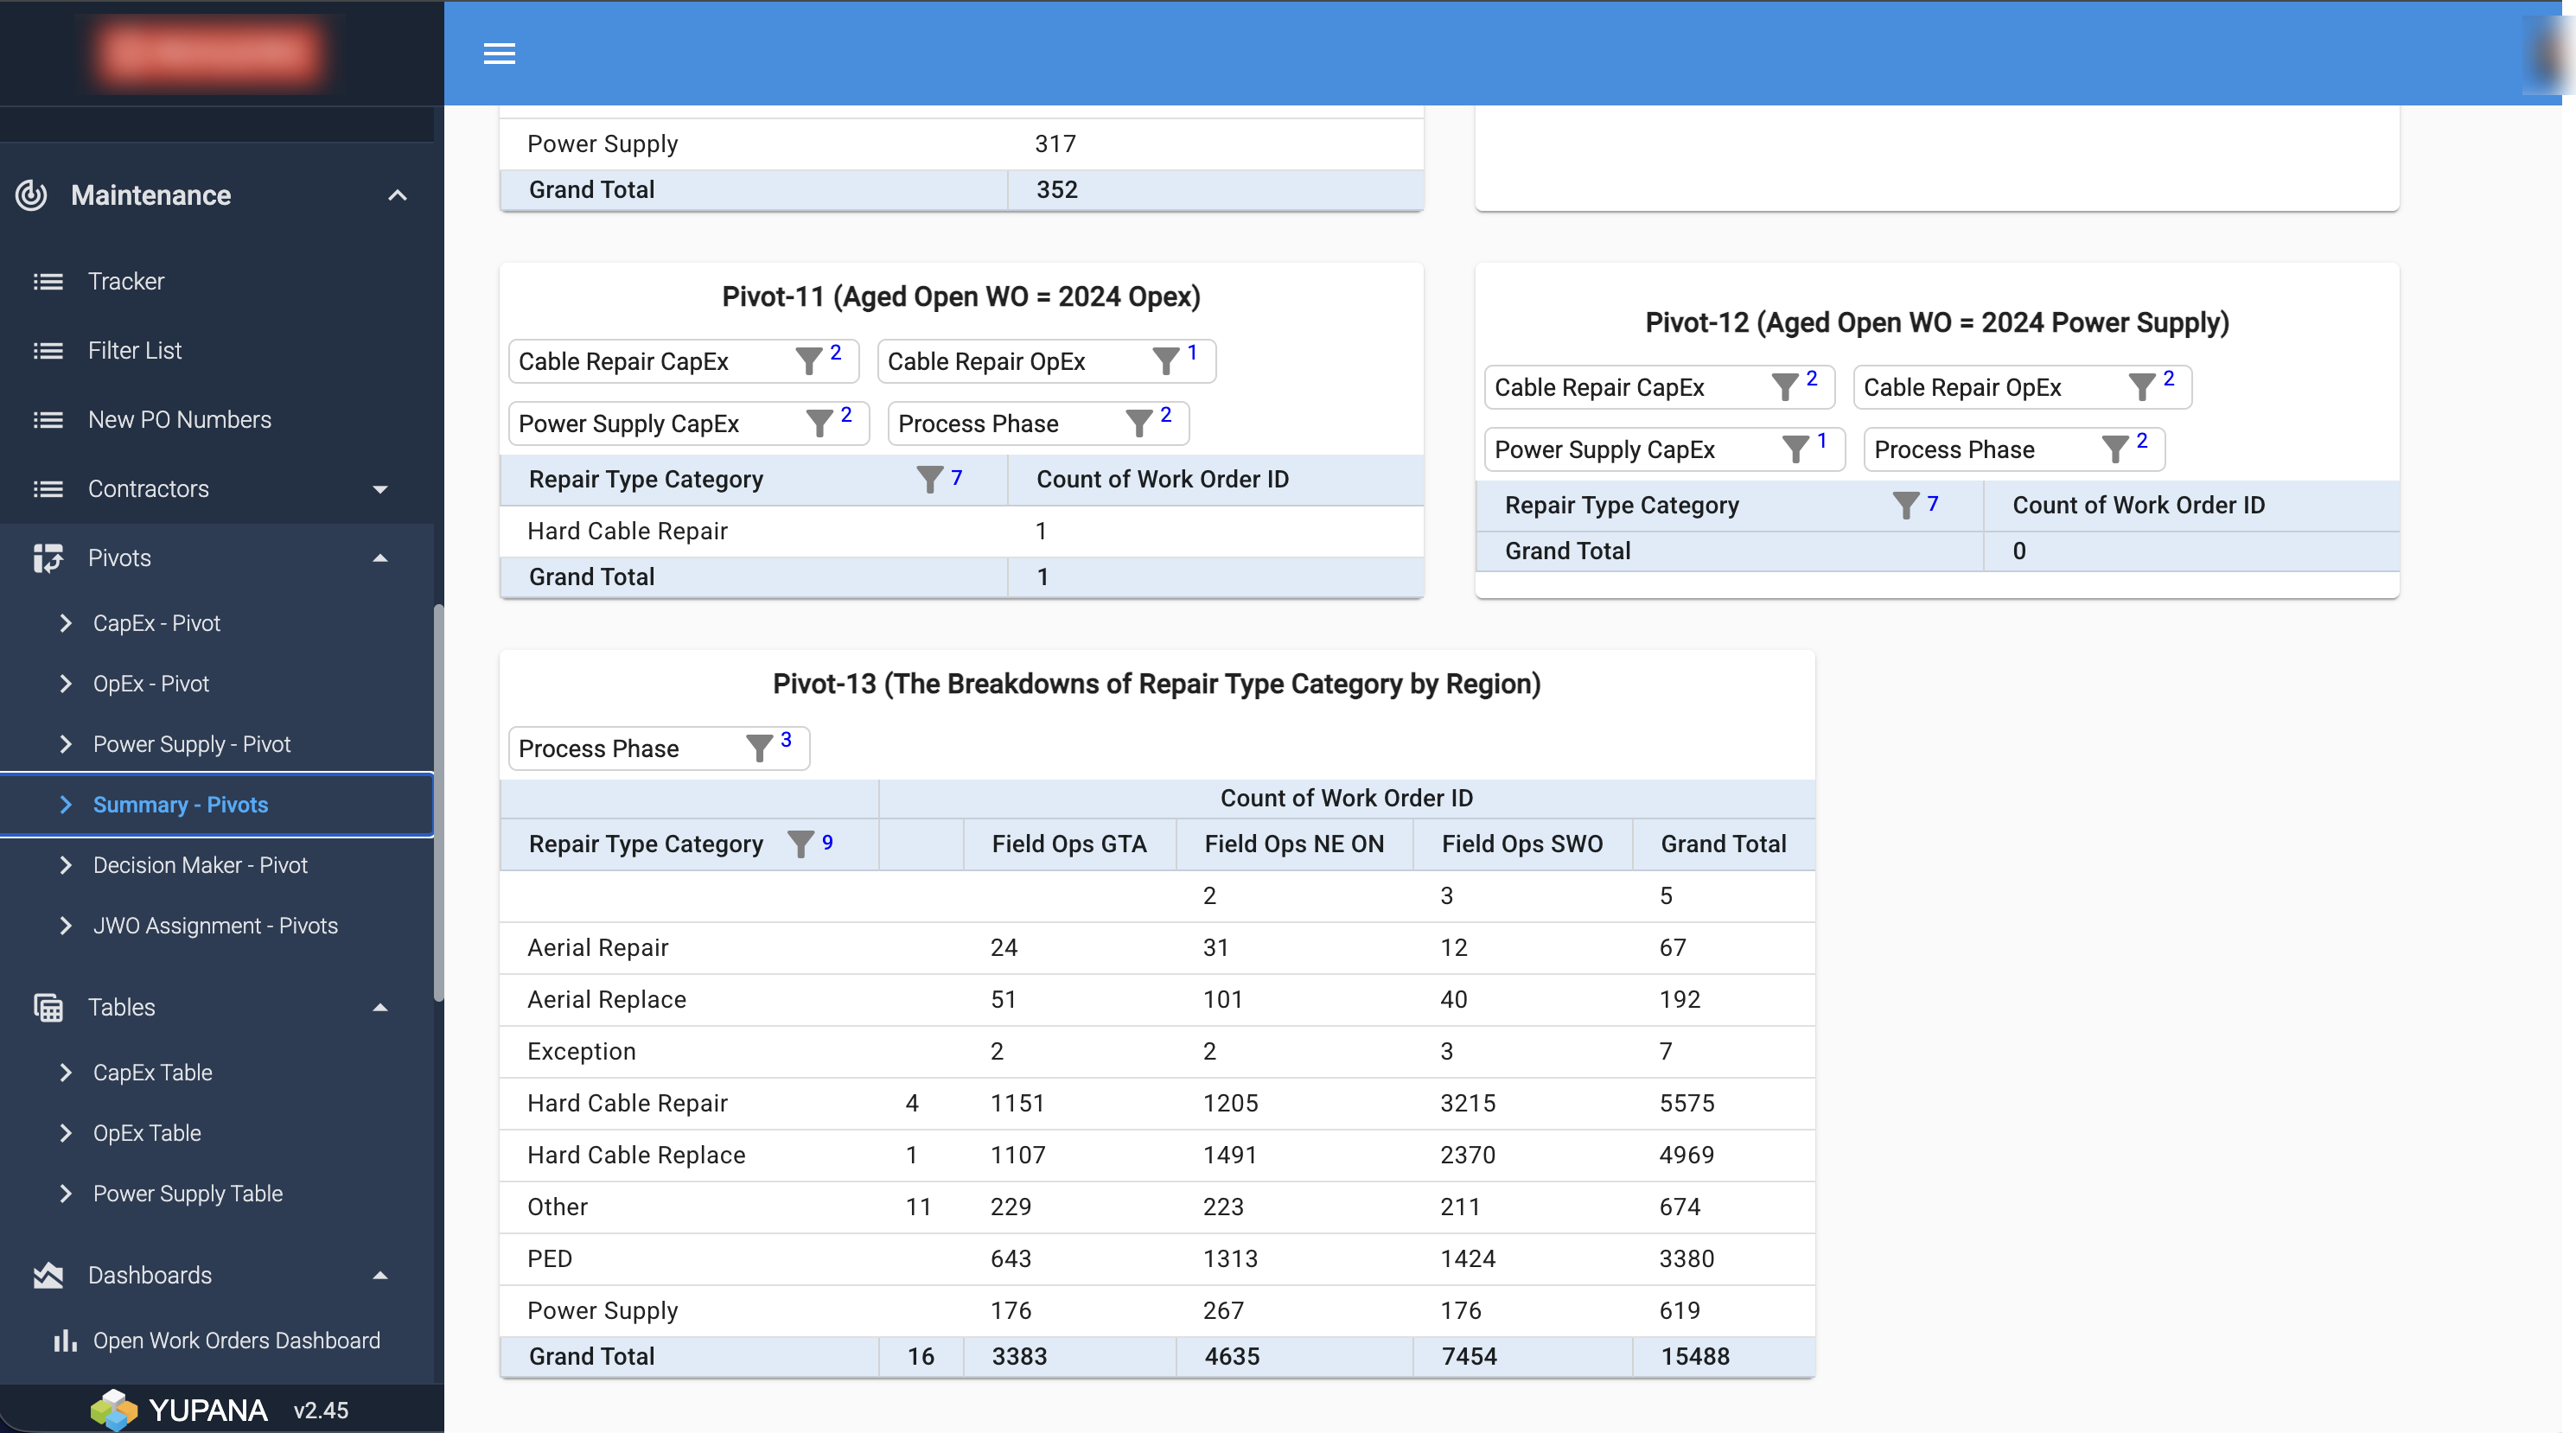
Unified Operations View
Key capabilities
- Map-based view of sites, routes, clusters, and regions
- Status layers: planned / in progress / on hold / completed / failed
- Filtering & search: by region, vendor, technology, contractor, project, priority
- Drill-down panels: from high-level heatmap into single site, fiber span, or ticket
Typical use:
A rollout manager sees all 4G/5G or FTTx projects in a region, highlights delayed work orders, and drills down to see site-level reasons (e.g., missing integration, failed OTDR, power issue).
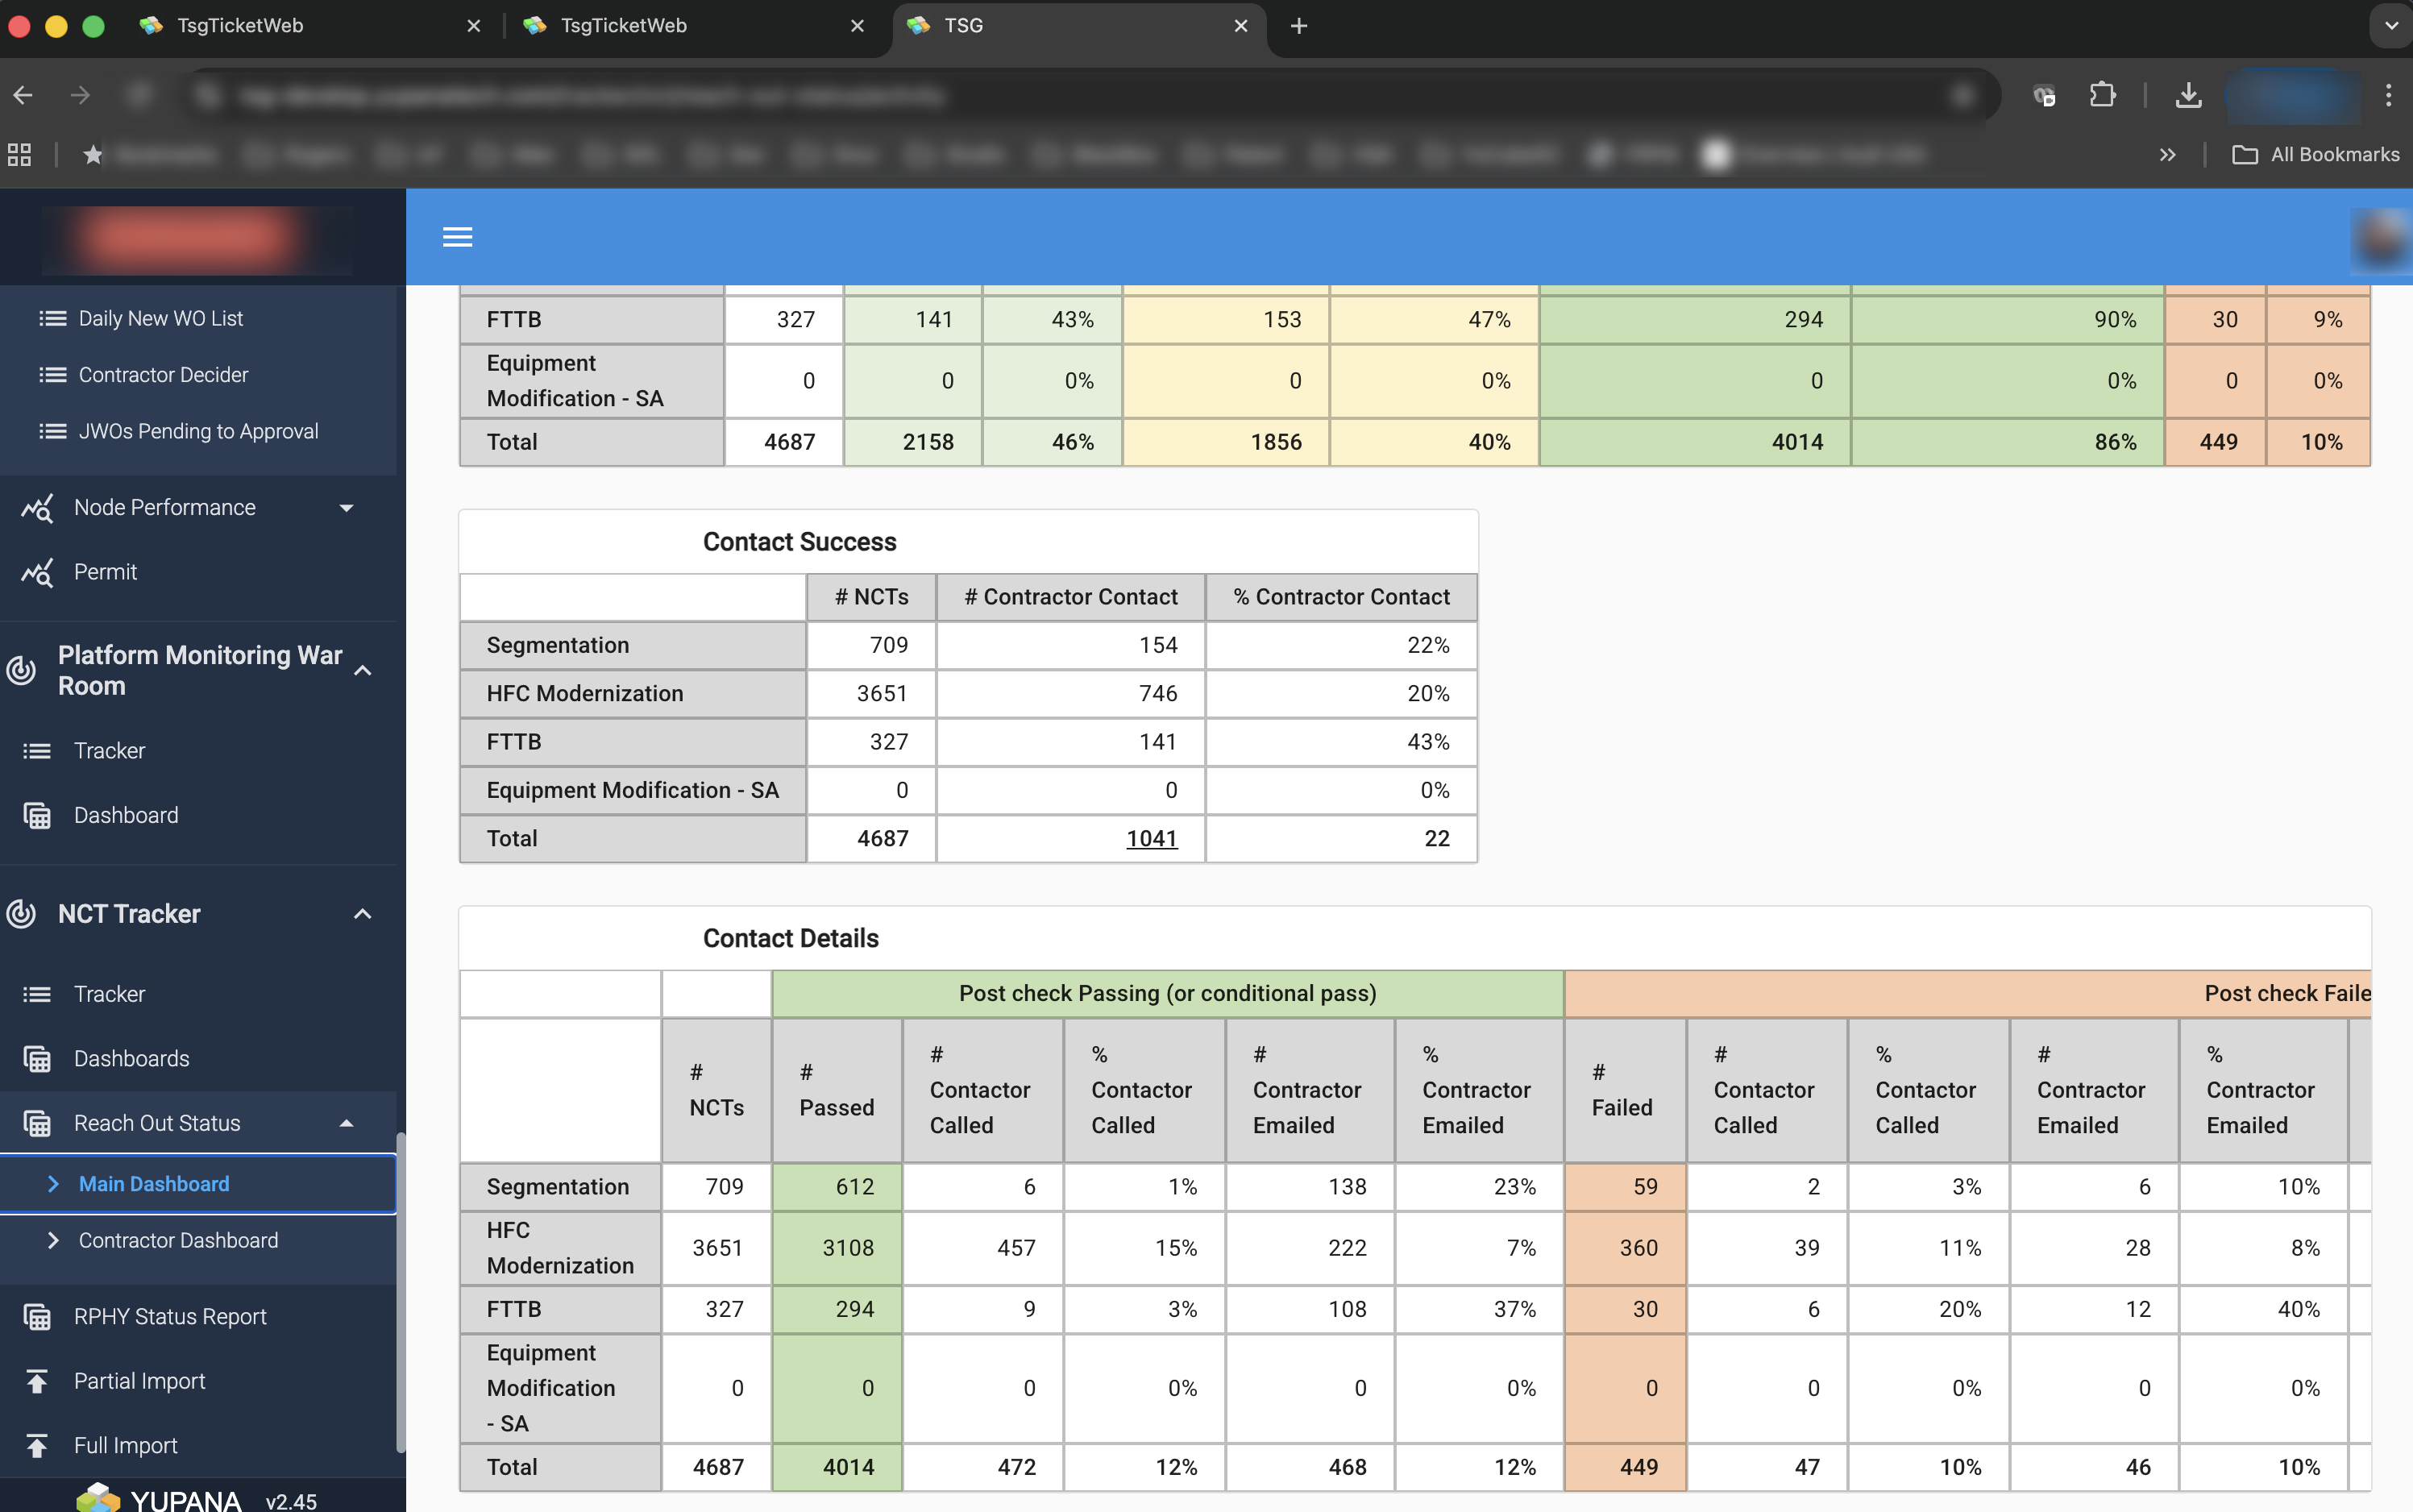
Ticketing & Work Order Management
TSG Operational Dashboard includes a light but powerful ticketing and work order engine designed for field projects:
- Ticket types: rollout, integration, acceptance, maintenance, fault, audit
- Work order lifecycle: created → assigned → on-site → in progress → verified → closed
- SLA & escalation: configurable timers, notifications, and escalation rules
- Attachments & evidence: photos, OTDR/OLTS files, site reports, YuCubeGC logs
- Contractor / crew assignment: who owns what, where, and when
This replaces scattered spreadsheets, emails, and messaging threads with a structured, auditable workflow.
Real-time integration with YuCubeGC & TSG Fiber
TSG Operational Dashboard is not just a “visualization” layer; it connects directly into other Yupana platforms:
- YuCubeGC integration
- Shows live site status (alarms, KPIs, integration state)
- Launches remote scripts or checks from within the dashboard
- Displays energy / NetZero status (grid, solar, hydrogen, battery) alongside RAN health
- TSG Fiber integration
- Fiber route and segment status on the same map
- OTDR/OLTS test results and pass/fail per span
- Acceptance status per route, segment, or customer hand-over package
This gives PMs and NOC teams an end-to-end view from fiber trench and power systems all the way up to RAN configuration.
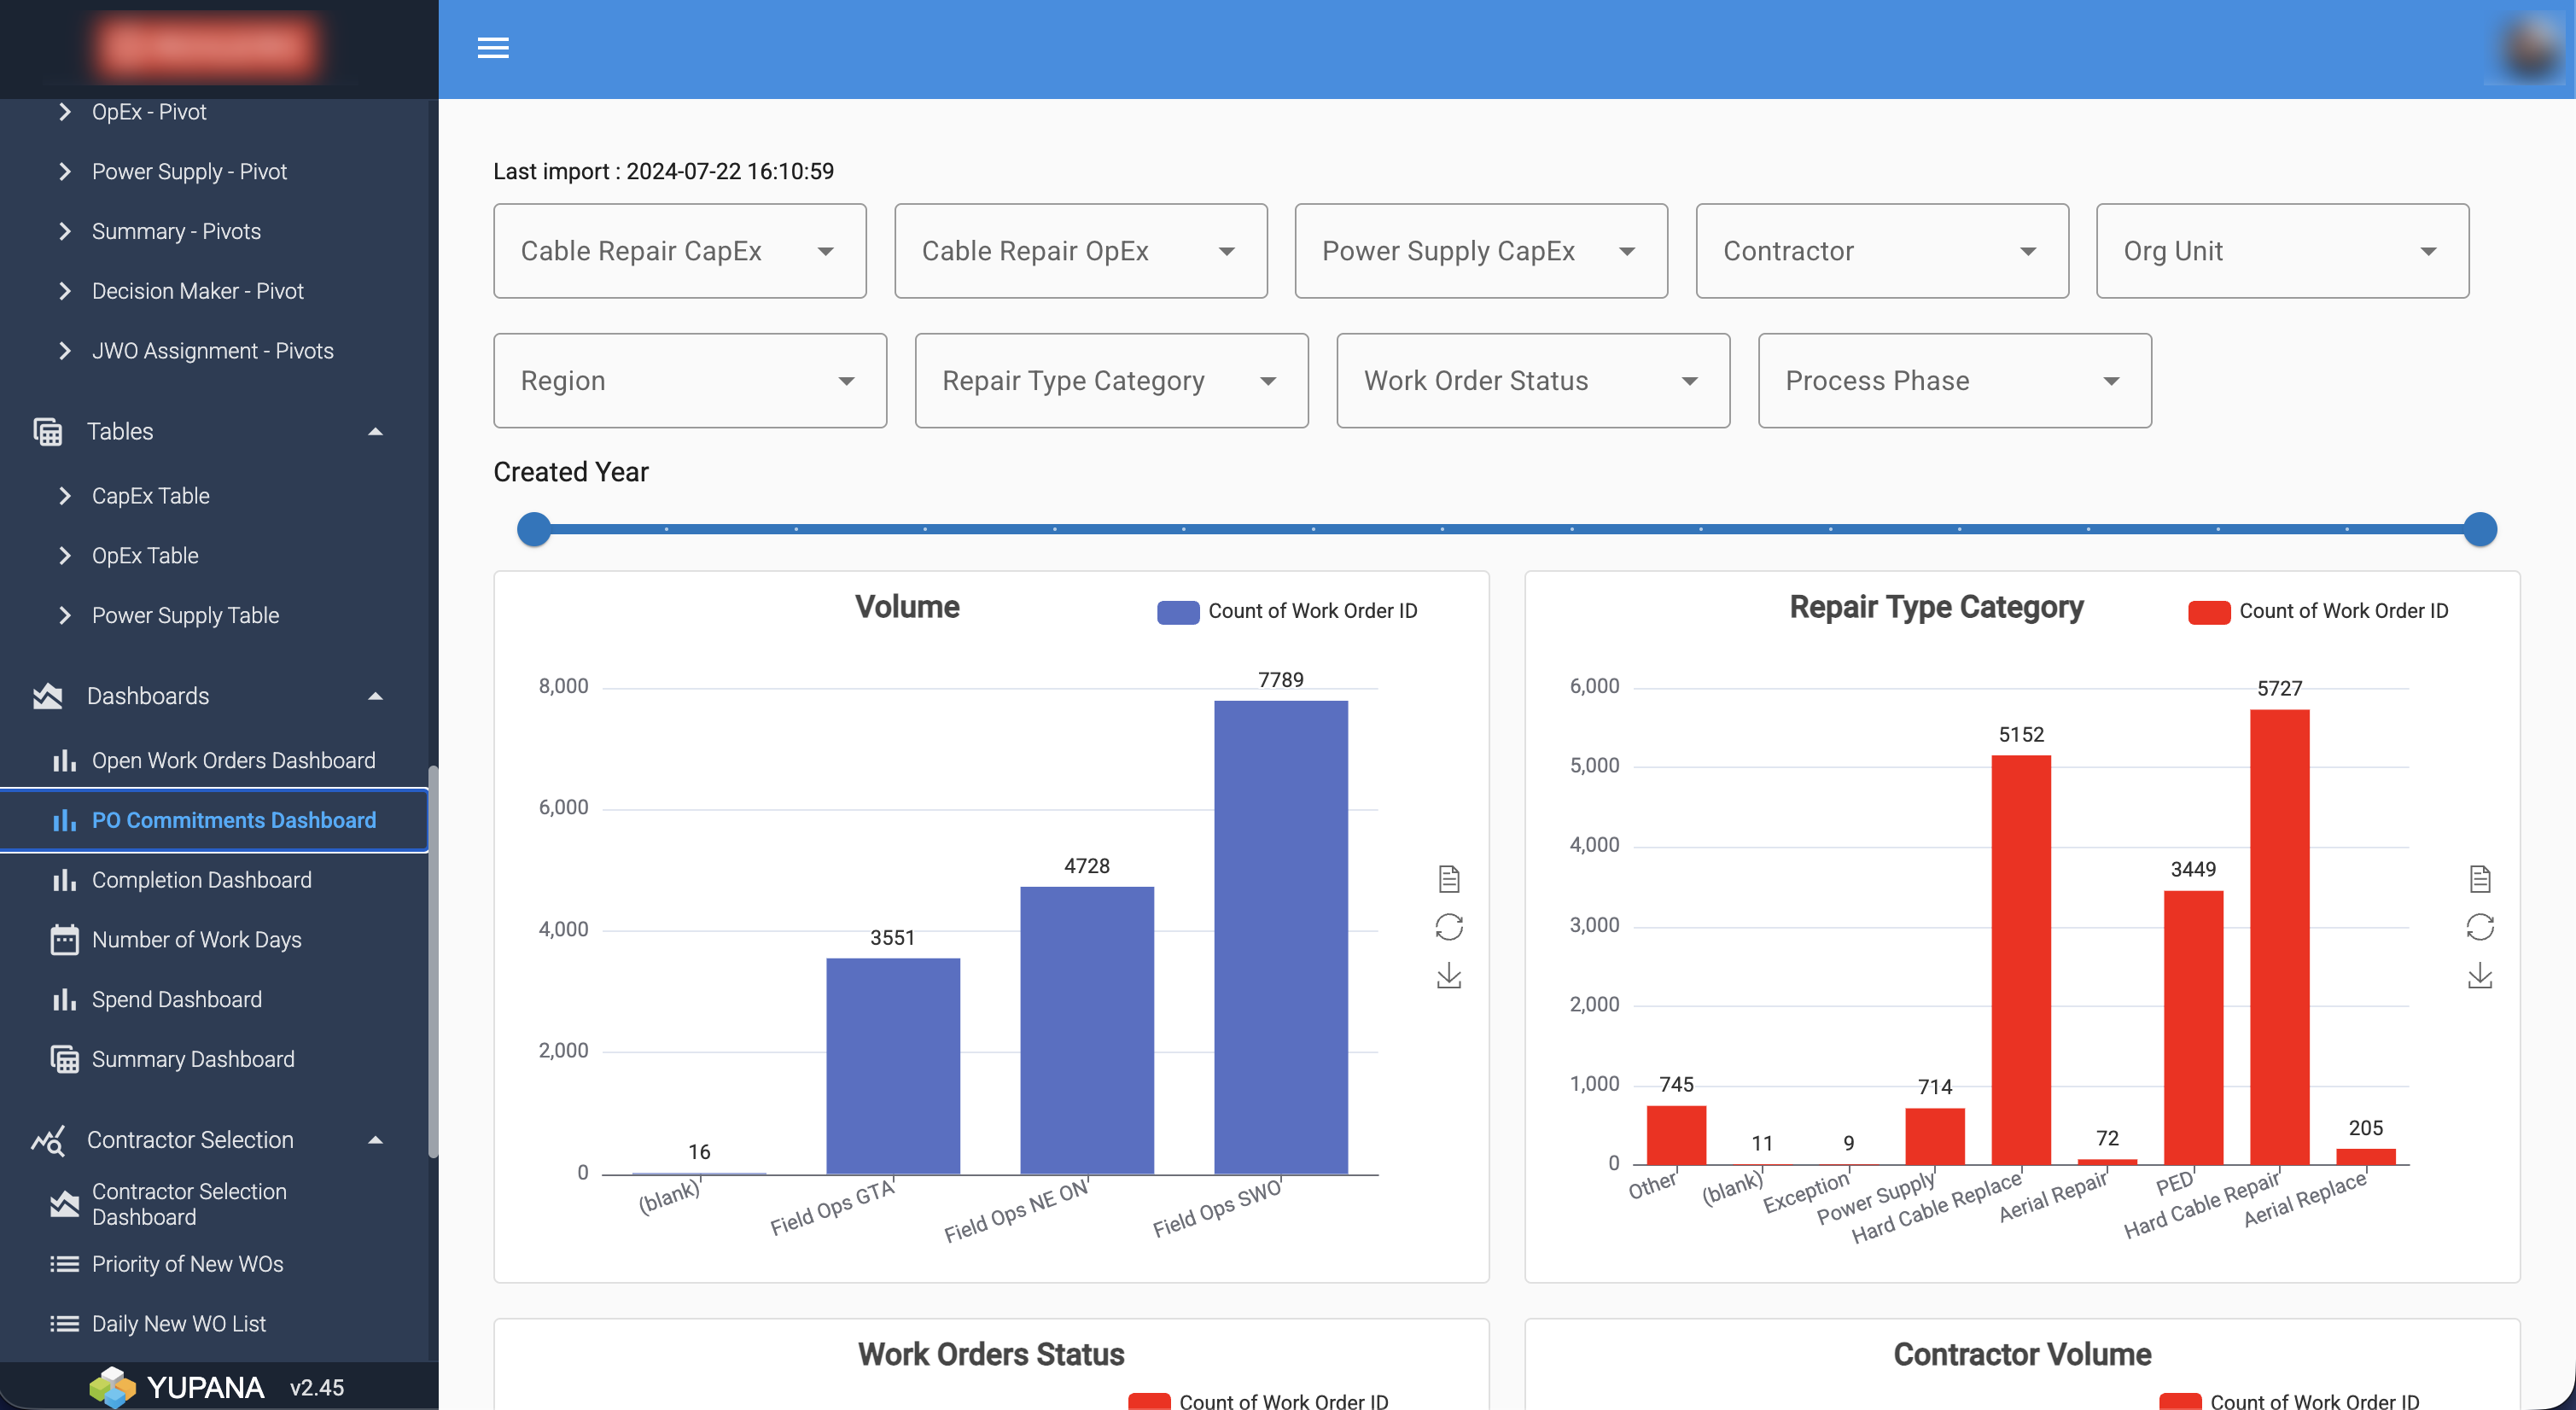
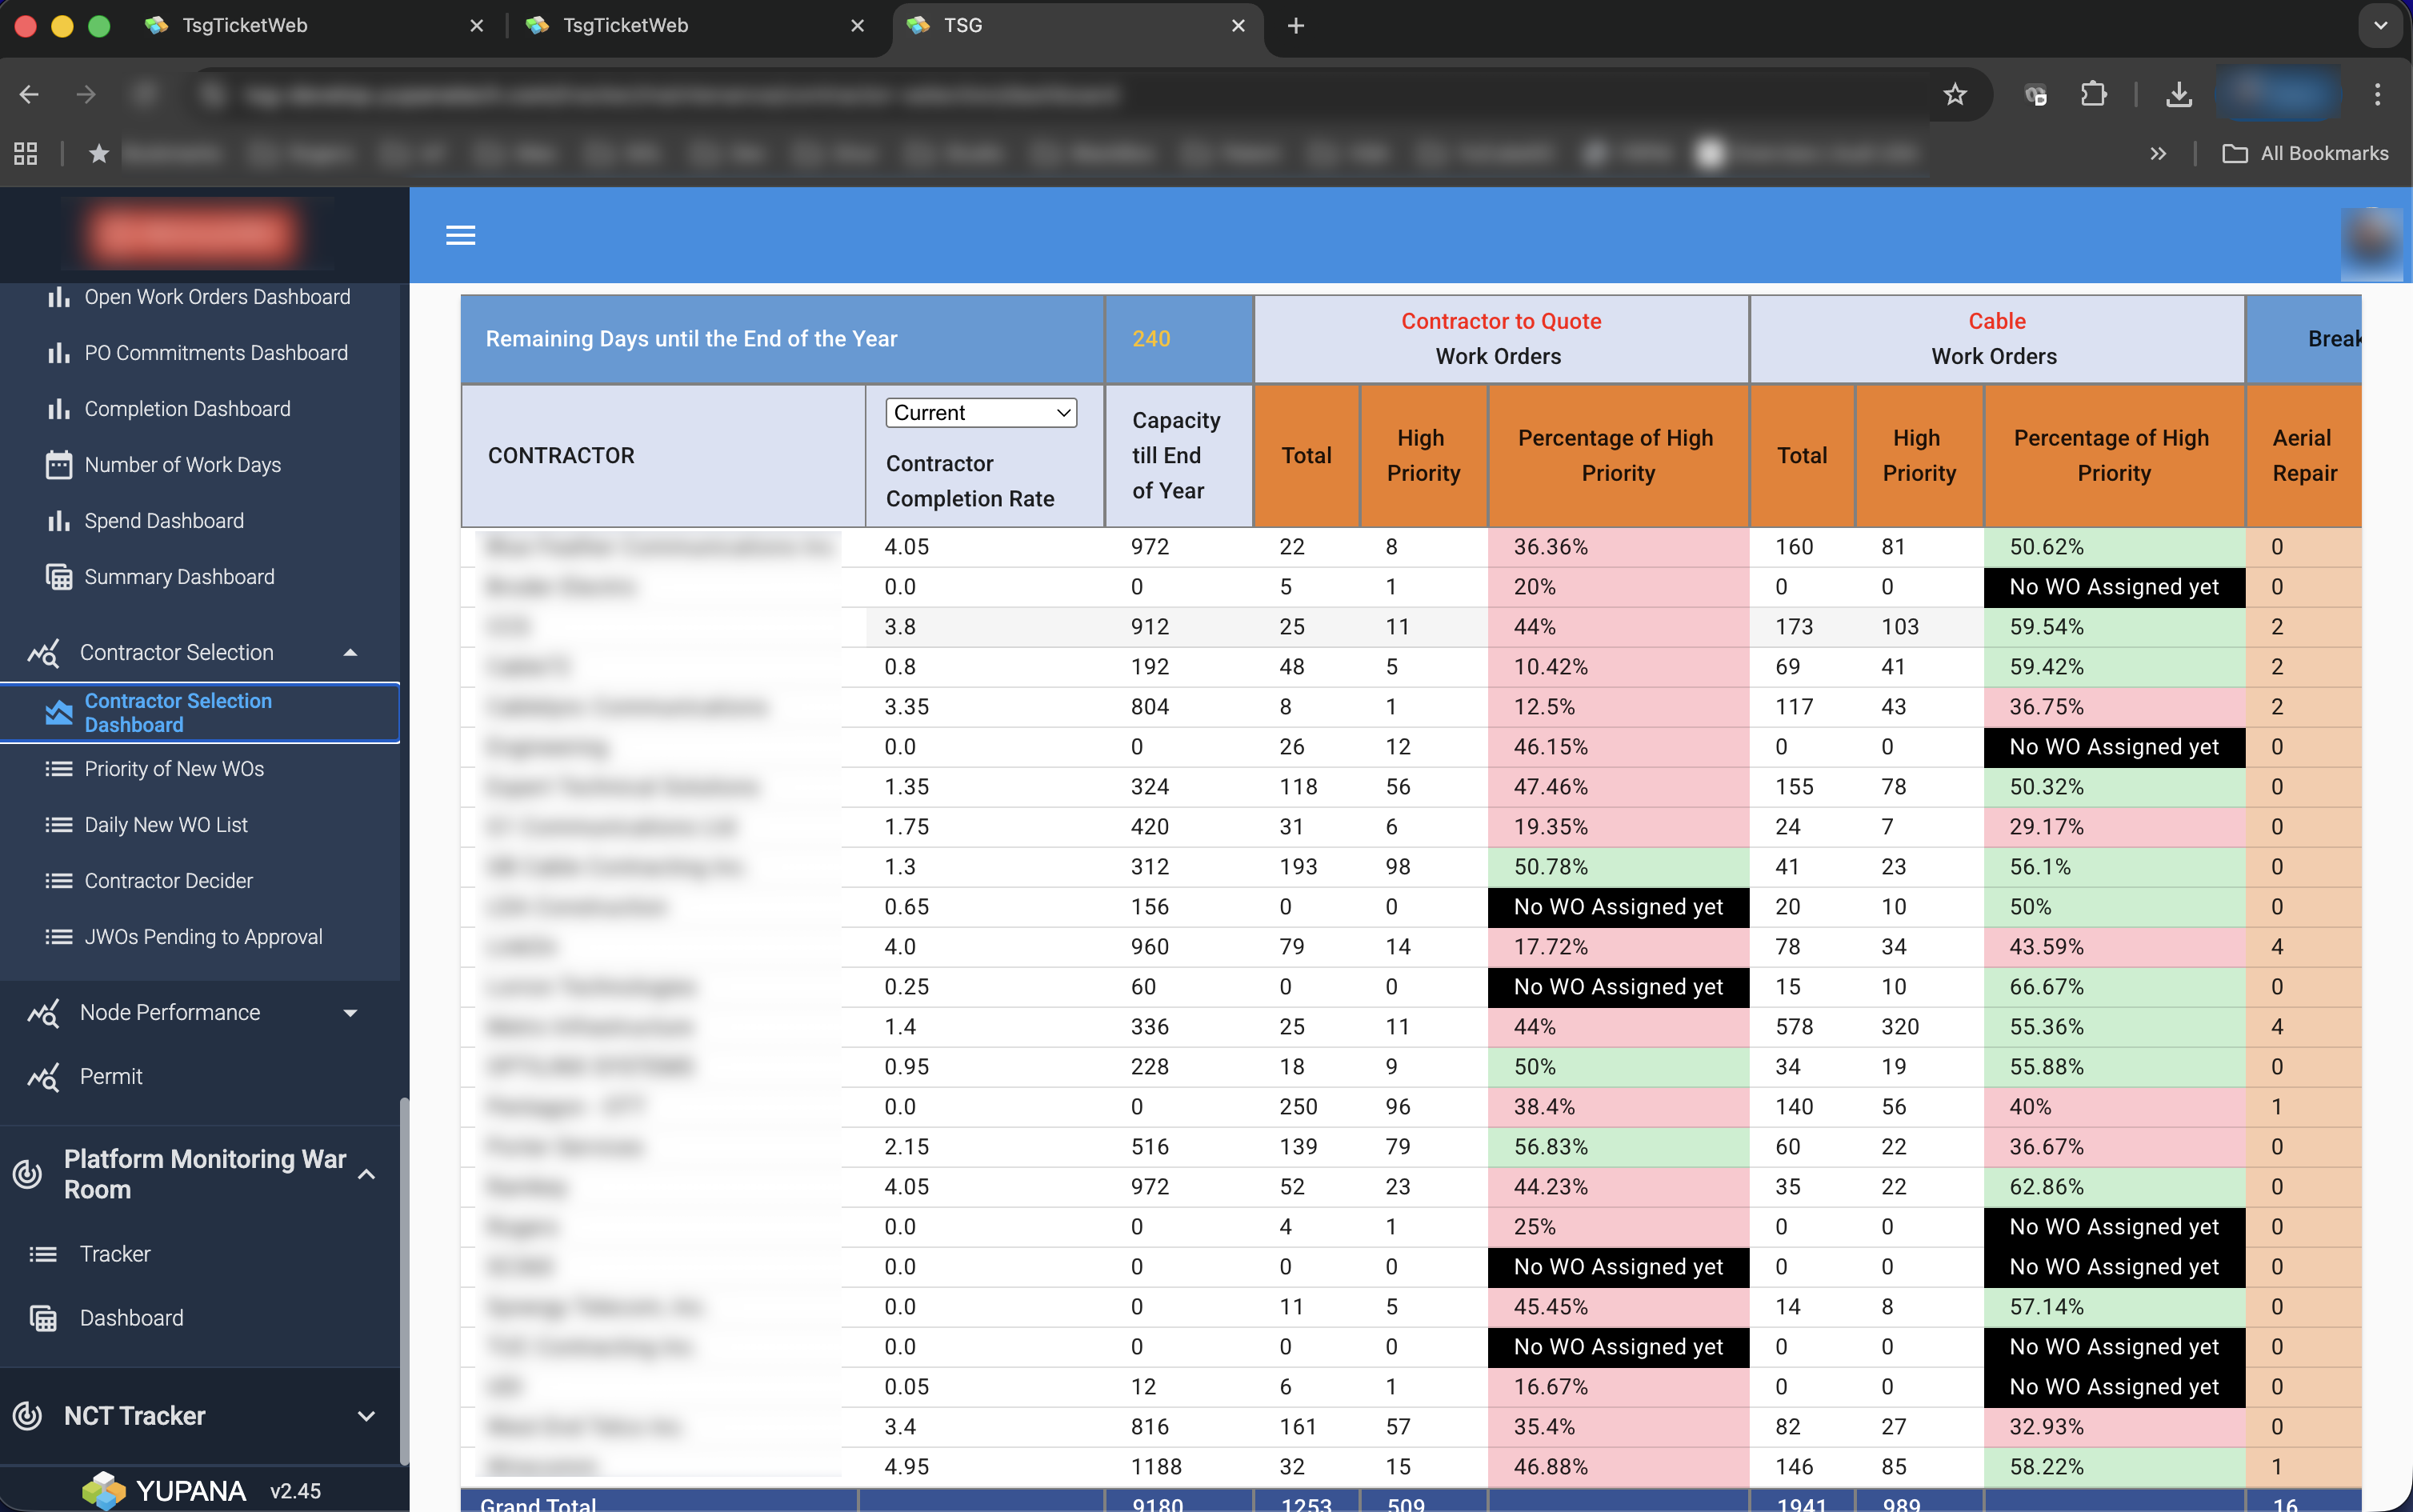
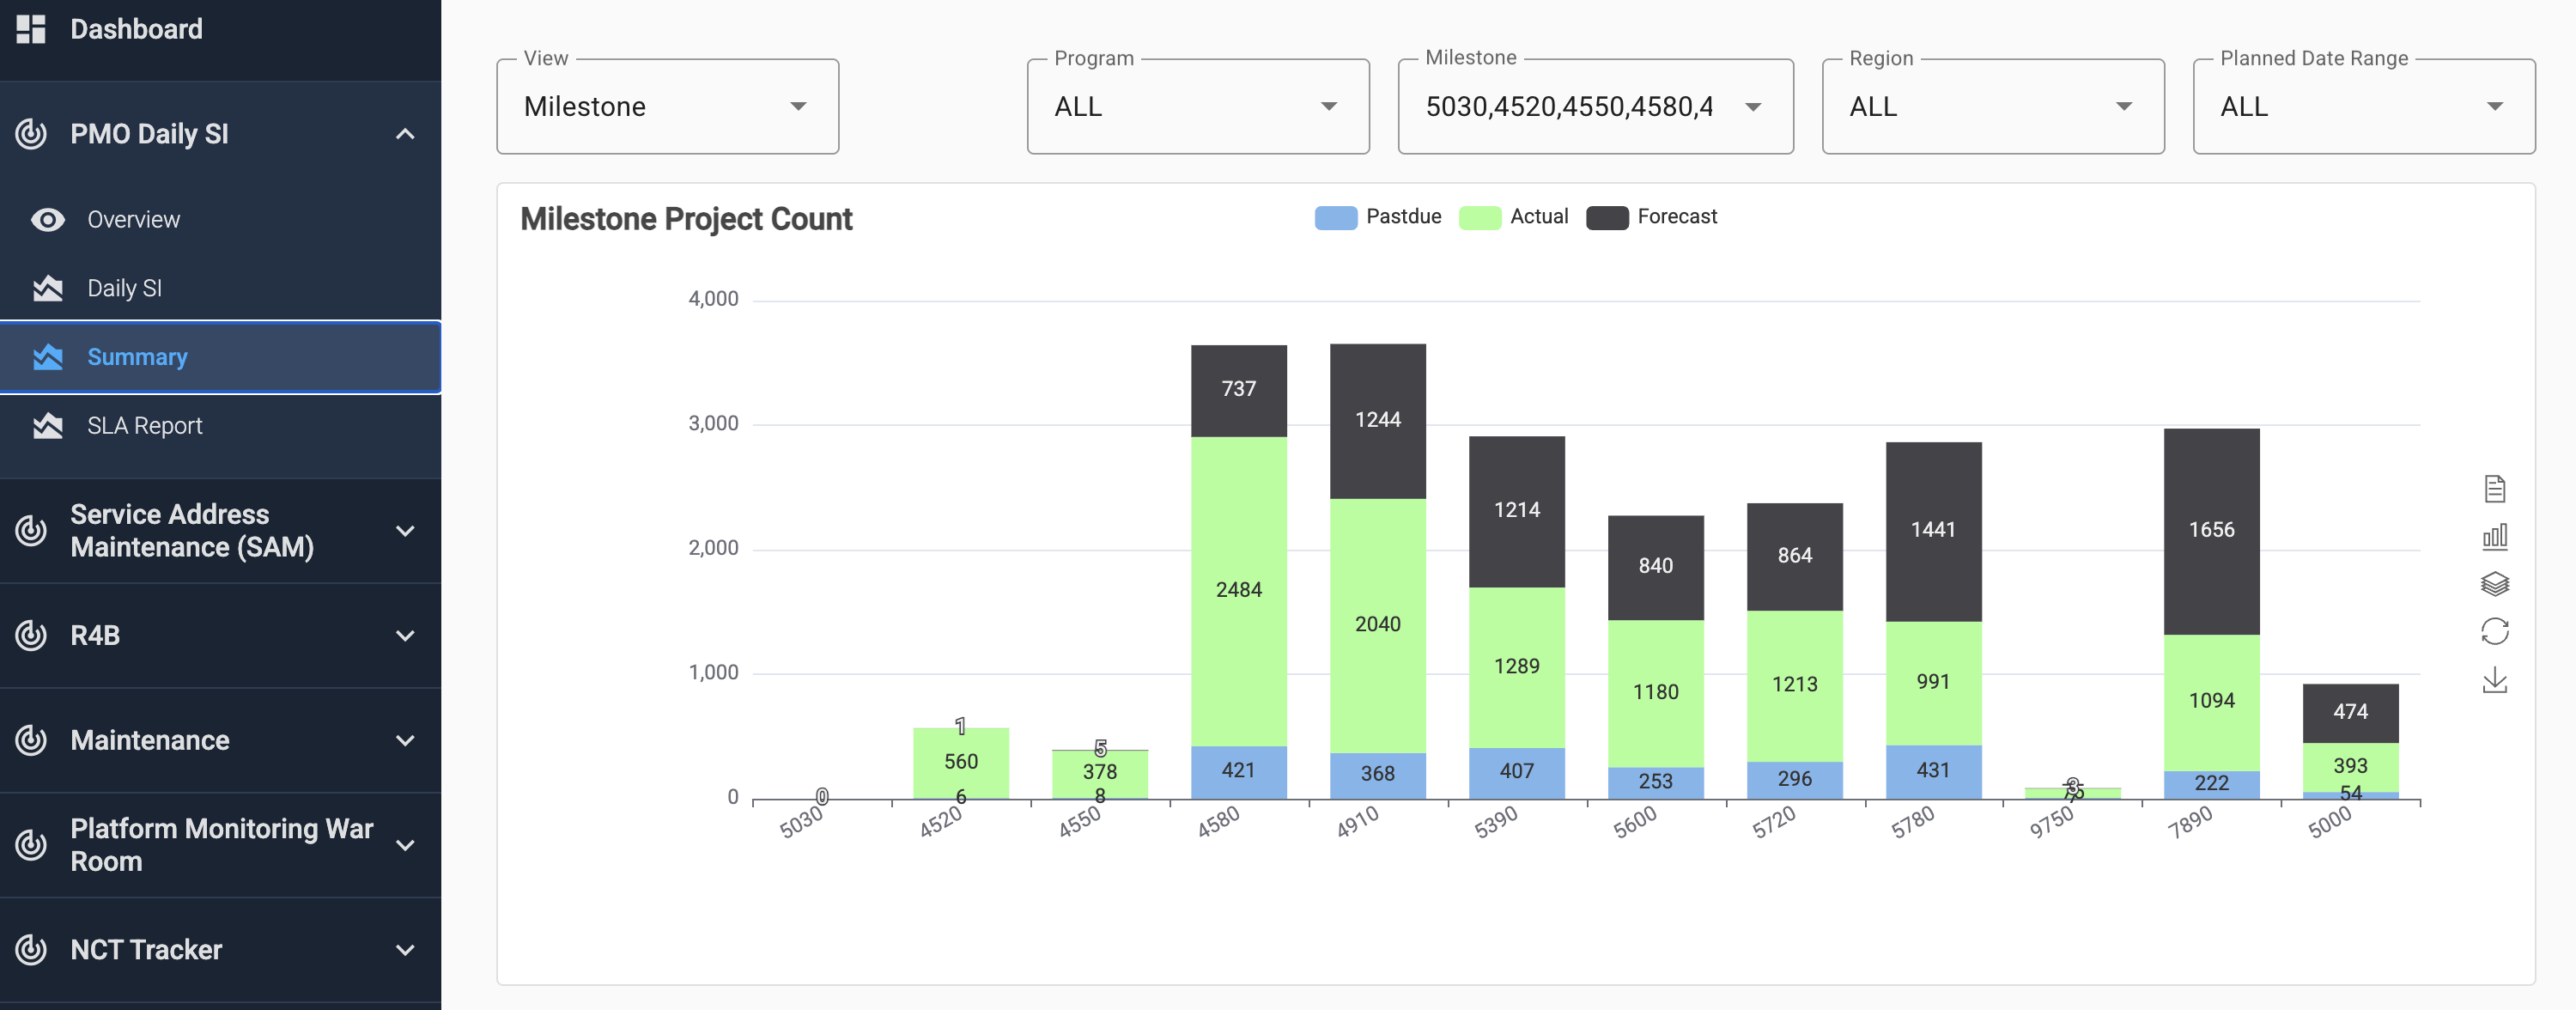
Analytics, KPIs & PMO reporting
TSG Operational Dashboard provides KPI views for both daily operations and management/PMO reporting:
- Rollout progress: sites/segments planned vs. completed, per region & vendor
- Quality metrics: first-time-right rates, re-visit counts, OTDR failure ratios, integration success rates
- Time metrics: average time to integrate, average time to fix, time in each ticket state
- Contractor performance: productivity, SLA compliance, rework percentage
- Financial impact (optional): penalties, incentives, and cost overruns linked to delays or failures
Reports can be exported as PDF/Excel, or scheduled for automatic delivery.
Users & Use Cases
Who uses TSG Operational Dashboard?
- Rollout and deployment managers
- NOC and Operations teams
- Fiber & RAN project managers
- PMO and executives
- Contractors and field supervisors (with role-based access)
Typical use cases
- Nationwide 4G/5G rollout
- FTTx / backbone fiber deployment
- Modernization and swap projects
- Preventive maintenance campaigns
- NetZero site monitoring (energy + network KPIs together)
Differentiators
- Designed specifically for telecom and infrastructure rollouts, not generic IT helpdesk.
- Deep integration with YuCubeGC and TSG Fiber for real technical status, not manual updates only.
- Map + timeline + ticket triad: see where, when, and what in one place.
- Suitable for both daily operations and executive / PMO reporting.
- Built by engineers who have actually run large multi-vendor, multi-region projects.